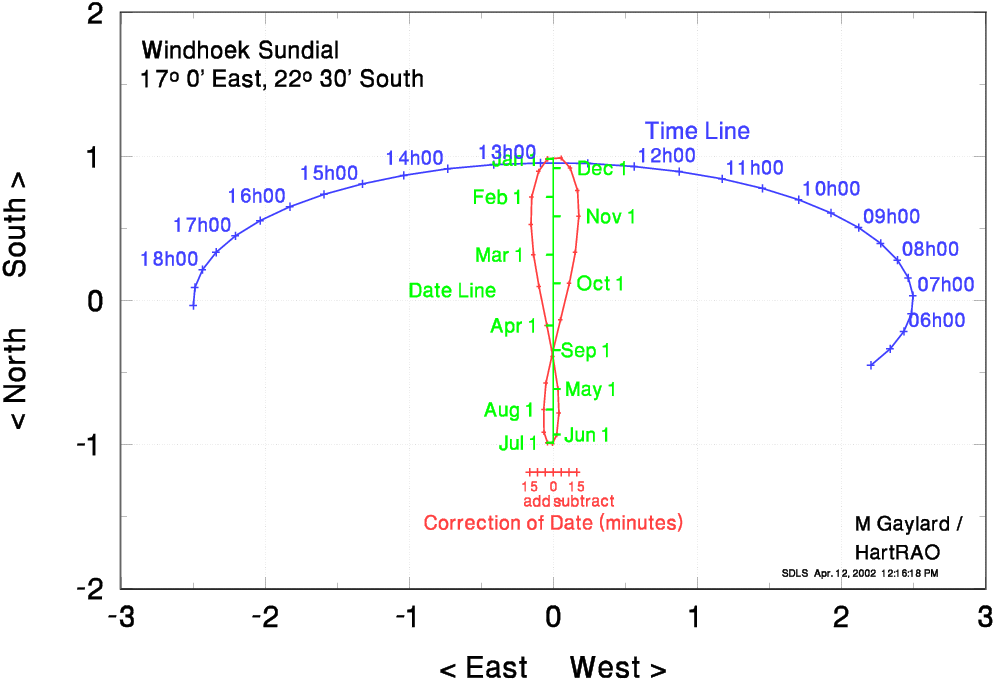

Note that the "squares" on the diagram must look square, ie one unit of length horizontally must equal one unit of length vertically.
The data used to create this sundial are listed below, if you want to make your own large "walk-on" sundial. The columns are:
       Windhoek, Namibia
        Time       Xtime       Ytime        date         Xan         Yan        Teqn       XTeqn
       05h00       2.207      -0.449       Jan01      -0.040       0.984      -15.00      -0.164
       05h30       2.342      -0.335       Jan15      -0.101       0.898      -10.00      -0.109
       06h00       2.436      -0.215       Feb01      -0.149       0.721       -5.00      -0.055
       06h30       2.488      -0.092       Feb15      -0.154       0.529        0.00       0.000
       07h00       2.498       0.033       Mar01      -0.135       0.317        5.00       0.055
       07h30       2.466       0.158       Mar15      -0.099       0.097       10.00       0.109
       08h00       2.391       0.280       Apr01      -0.044      -0.174       15.00       0.164
       08h30       2.275       0.397       Apr15      -0.001      -0.388
       09h00       2.120       0.507       May01       0.033      -0.615
       09h30       1.929       0.609       May15       0.040      -0.782
       10h00       1.705       0.700       Jun01       0.025      -0.932
       10h30       1.452       0.779       Jun15      -0.004      -0.994
       11h00       1.174       0.845       Jul01      -0.039      -0.988
       11h30       0.876       0.896       Jul15      -0.065      -0.916
       12h00       0.562       0.932       Aug01      -0.067      -0.758
       12h30       0.240       0.952       Aug15      -0.050      -0.573
       13h00      -0.087       0.956       Sep01       0.000      -0.345
       13h30      -0.413       0.944       Sep15       0.051      -0.133
       14h00      -0.731       0.915       Oct01       0.112       0.119
       14h30      -1.037       0.871       Oct15       0.154       0.336
       15h00      -1.325       0.811       Nov01       0.179       0.586
       15h30      -1.590       0.738       Nov15       0.169       0.764
       16h00      -1.828       0.652       Dec01       0.119       0.920
       16h30      -2.035       0.556       Dec15       0.055       0.991
       17h00      -2.207       0.449                  -0.040       0.984
       17h30      -2.342       0.335
       18h00      -2.436       0.215
       18h30      -2.488       0.092
       19h00      -2.498      -0.033
Note that no allowance is made for daylight saving time.