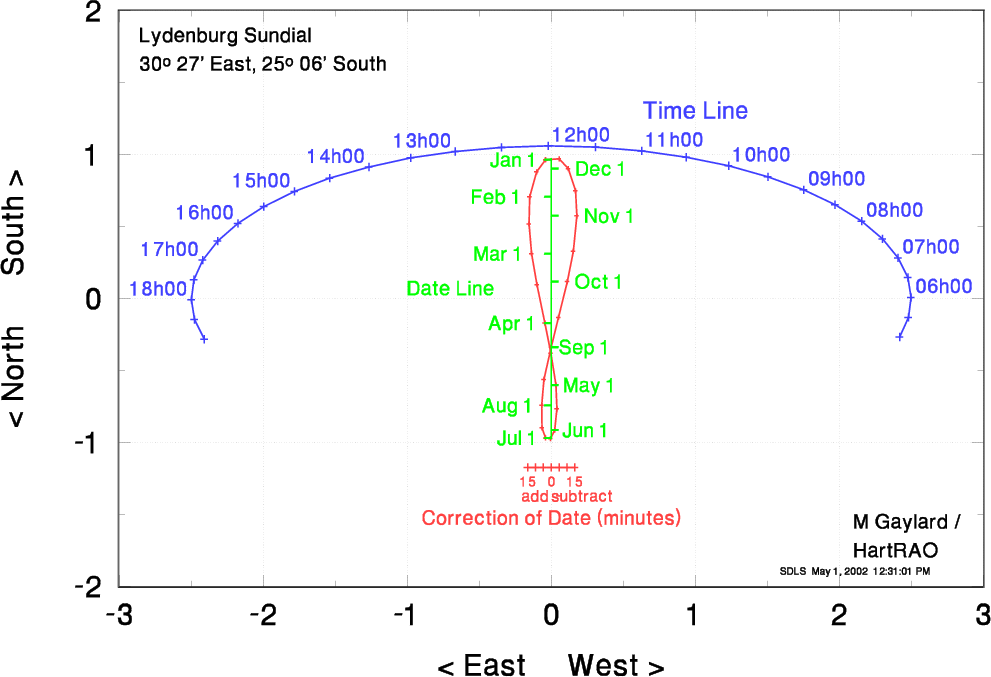

Note that the "squares" on the diagram must look square, ie one unit of length horizontally must equal one unit of length vertically.
The data used to create this sundial are listed below, if you want to make your own large "walk-on" sundial. The columns are:
       Lydenburg Area

        Time       Xtime       Ytime        date         Xan         Yan        Teqn       XTeqn
       05h00       2.420      -0.266       Jan01      -0.040       0.964      -15.00      -0.164
       05h30       2.481      -0.130       Jan15      -0.101       0.880      -10.00      -0.109
       06h00       2.500       0.008       Feb01      -0.149       0.707       -5.00      -0.055
       06h30       2.476       0.147       Feb15      -0.154       0.519        0.00       0.000
       07h00       2.410       0.283       Mar01      -0.135       0.311        5.00       0.055
       07h30       2.302       0.414       Mar15      -0.099       0.095       10.00       0.109
       08h00       2.155       0.537       Apr01      -0.044      -0.170       15.00       0.164
       08h30       1.971       0.652       Apr15      -0.001      -0.380
       09h00       1.754       0.756       May01       0.033      -0.602
       09h30       1.506       0.846       May15       0.040      -0.767
       10h00       1.233       0.923       Jun01       0.025      -0.913
       10h30       0.939       0.983       Jun15      -0.004      -0.974
       11h00       0.628       1.026       Jul01      -0.039      -0.968
       11h30       0.307       1.052       Jul15      -0.065      -0.897
       12h00      -0.020       1.060       Aug01      -0.067      -0.743
       12h30      -0.346       1.050       Aug15      -0.050      -0.562
       13h00      -0.666       1.022       Sep01       0.000      -0.338
       13h30      -0.975       0.977       Sep15       0.051      -0.130
       14h00      -1.267       0.914       Oct01       0.112       0.117
       14h30      -1.537       0.836       Oct15       0.154       0.329
       15h00      -1.782       0.744       Nov01       0.179       0.574
       15h30      -1.995       0.639       Nov15       0.169       0.749
       16h00      -2.175       0.523       Dec01       0.119       0.902
       16h30      -2.317       0.398       Dec15       0.055       0.972
       17h00      -2.420       0.266                  -0.040       0.964
       17h30      -2.481       0.130
       18h00      -2.500      -0.008
       18h30      -2.476      -0.147
       19h00      -2.410      -0.283