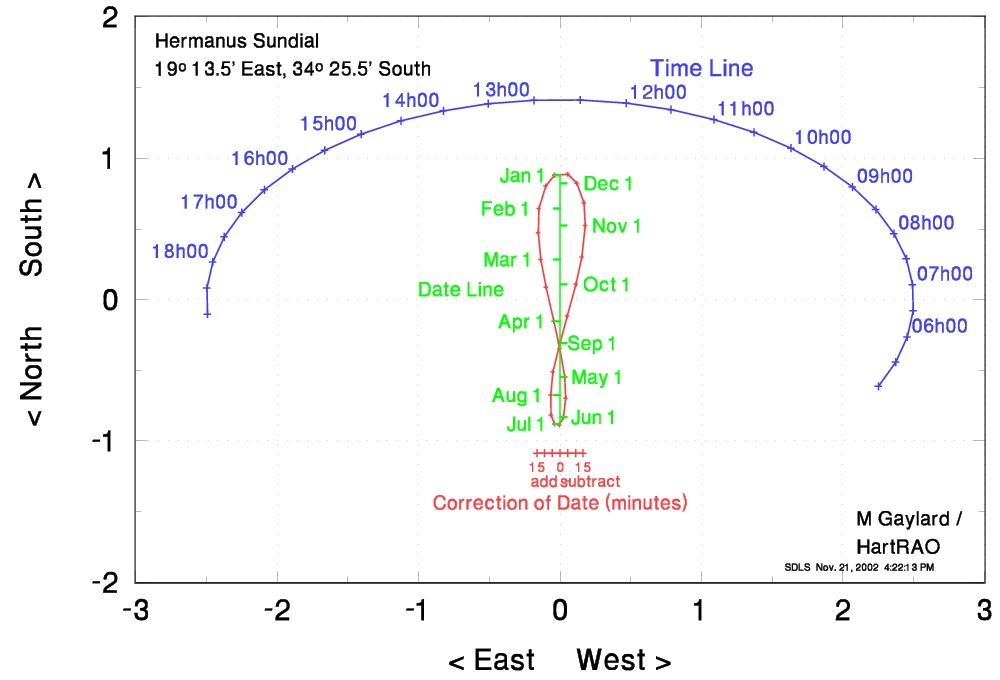
Note that the "squares" on the diagram must look square, ie one unit of length horizontally must equal one unit of length vertically.
The data used to create this sundial are listed below, if you want to make your own large "walk-on" sundial. The columns are:
        Time       Xtime       Ytime        date         Xan         Yan        Teqn       XTeqn
       05h00       2.251      -0.615       Jan01      -0.040       0.878      -15.00      -0.164
       05h30       2.374      -0.443       Jan15      -0.101       0.802      -10.00      -0.109
       06h00       2.456      -0.264       Feb01      -0.149       0.644       -5.00      -0.055
       06h30       2.496      -0.081       Feb15      -0.154       0.472        0.00       0.000
       07h00       2.493       0.104       Mar01      -0.135       0.283        5.00       0.055
       07h30       2.448       0.287       Mar15      -0.099       0.086       10.00       0.109
       08h00       2.361       0.465       Apr01      -0.044      -0.155       15.00       0.164
       08h30       2.233       0.636       Apr15      -0.001      -0.346
       09h00       2.067       0.795       May01       0.033      -0.549
       09h30       1.866       0.941       May15       0.040      -0.698
       10h00       1.633       1.070       Jun01       0.025      -0.832
       10h30       1.372       1.182       Jun15      -0.004      -0.887
       11h00       1.087       1.273       Jul01      -0.039      -0.882
       11h30       0.784       1.342       Jul15      -0.065      -0.818
       12h00       0.467       1.388       Aug01      -0.067      -0.677
       12h30       0.143       1.411       Aug15      -0.050      -0.512
       13h00      -0.184       1.409       Sep01       0.000      -0.308
       13h30      -0.508       1.384       Sep15       0.051      -0.118
       14h00      -0.823       1.335       Oct01       0.112       0.106
       14h30      -1.124       1.262       Oct15       0.154       0.300
       15h00      -1.406       1.169       Nov01       0.179       0.523
       15h30      -1.664       1.055       Nov15       0.169       0.682
       16h00      -1.893       0.923       Dec01       0.119       0.821
       16h30      -2.090       0.775       Dec15       0.055       0.885
       17h00      -2.251       0.615                  -0.040       0.878
       17h30      -2.374       0.443
       18h00      -2.456       0.264
       18h30      -2.496       0.081
       19h00      -2.493      -0.104