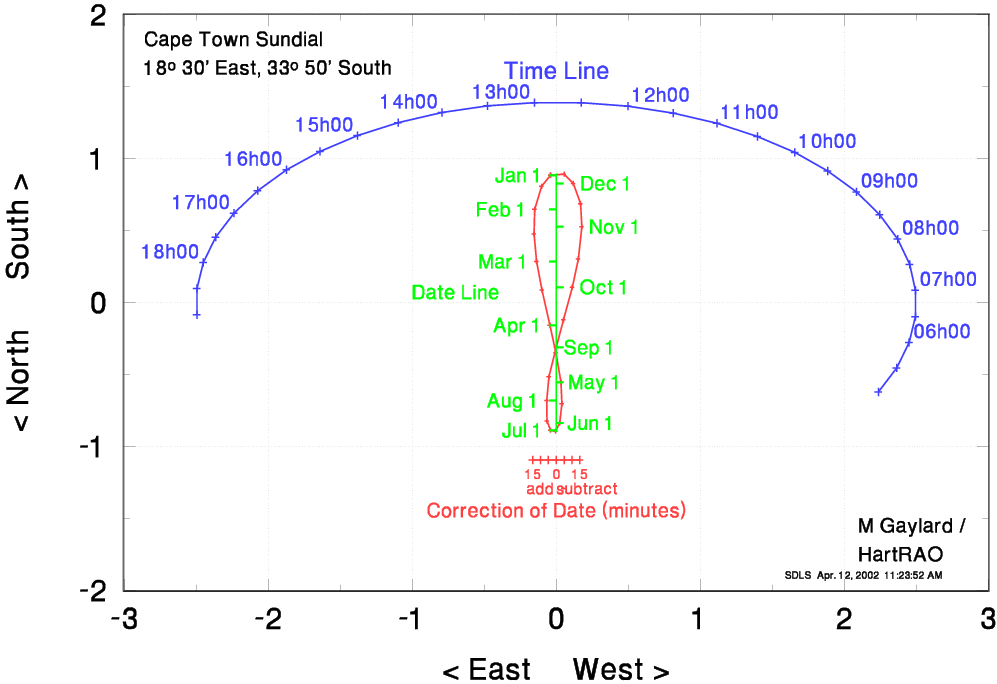

Note that the "squares" on the diagram must look square, ie one unit of length horizontally must equal one unit of length vertically.
The data used to create this sundial are listed below, if you want to make your own large "walk-on" sundial. The columns are:
       Cape Town Area

        Time       Xtime       Ytime        date         Xan         Yan        Teqn       XTeqn
       05h00       2.237      -0.621       Jan01      -0.040       0.884      -15.00      -0.164
       05h30       2.364      -0.453       Jan15      -0.101       0.807      -10.00      -0.109
       06h00       2.450      -0.278       Feb01      -0.149       0.648       -5.00      -0.055
       06h30       2.494      -0.097       Feb15      -0.154       0.476        0.00       0.000
       07h00       2.495       0.085       Mar01      -0.135       0.285        5.00       0.055
       07h30       2.454       0.266       Mar15      -0.099       0.087       10.00       0.109
       08h00       2.371       0.442       Apr01      -0.044      -0.156       15.00       0.164
       08h30       2.247       0.610       Apr15      -0.001      -0.348
       09h00       2.085       0.768       May01       0.033      -0.553
       09h30       1.887       0.913       May15       0.040      -0.703
       10h00       1.657       1.042       Jun01       0.025      -0.838
       10h30       1.398       1.154       Jun15      -0.004      -0.893
       11h00       1.115       1.246       Jul01      -0.039      -0.888
       11h30       0.814       1.316       Jul15      -0.065      -0.823
       12h00       0.498       1.364       Aug01      -0.067      -0.681
       12h30       0.174       1.389       Aug15      -0.050      -0.516
       13h00      -0.153       1.389       Sep01       0.000      -0.310
       13h30      -0.477       1.366       Sep15       0.051      -0.119
       14h00      -0.793       1.320       Oct01       0.112       0.107
       14h30      -1.096       1.251       Oct15       0.154       0.302
       15h00      -1.380       1.161       Nov01       0.179       0.527
       15h30      -1.640       1.051       Nov15       0.169       0.687
       16h00      -1.872       0.922       Dec01       0.119       0.827
       16h30      -2.073       0.778       Dec15       0.055       0.891
       17h00      -2.237       0.621                  -0.040       0.884
       17h30      -2.364       0.453
       18h00      -2.450       0.278
       18h30      -2.494       0.097
       19h00      -2.495      -0.085