
HartRAO Home >
Continuum Observing with the Hart 26m Telescope
Continuum Observing with the Hart 26m Telescope
Radio continuum emission is the broadband radiation emitted in the radio
part of the spectrum by celestial objects. Its intensity (brightness
temperature) typically varies relatively slowly as a function of wavelength
(or frequency). This is in contrast to the narrow emission lines produced
at characteristic frequencies by atoms and molecules. Continuum observations
can be made with all installed receivers at HartRAO.
|
|---|
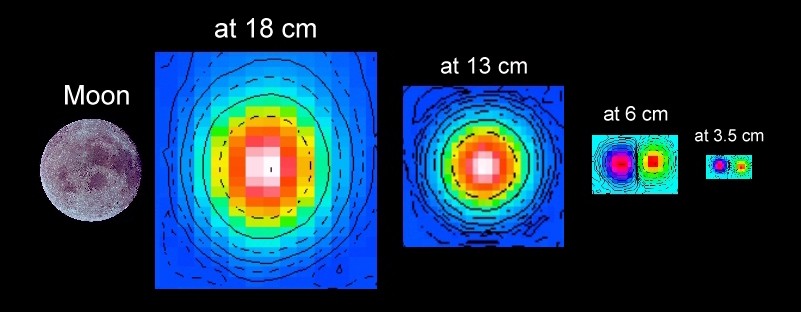
This picture shows how much of the sky is "seen"
by the radio telescope in four of the wavelength bands in which it operates.
The angular size of the moon is shown for comparison. The circular patch of
sky seen at each wavelength is called the "beam" of the telescope. The size
of the beam is proportional to the wavelength.
At wavelengths of 6 and 3.5 cm, dual feed systems are installed so
that the telescope "sees" two patches in the sky next to each other when
operating in the beam-switched mode. This is used to cancel out atmospheric
effects that are common to both beams. The receiver output is proportional
to the difference in the signal in the two beams.
Technically, the pictures of what is seen at each wavelength show
the main lobe of each antenna beam pattern. Physicists will recognise this
as the central part of the diffraction pattern of a circular aperture.
Starting at the centre of the beam, each black contour line is at half the
level of the previous one. Weak ring-like sidelobes lie beyond the main
lobe, but are not shown here.
Image by Mike Gaylard, HartRAO
Point source flux measurements
For flux measurements of unresolved ("point") sources, several observing
methods are available:
- drift scans, with scans offset at the half-power points North and South
if needed to check pointing accuracy
- crossed scans
- five-point stepping at the first nulls of the beam, the half-power points
and on source, in the RA and DEC directions.
These enable pointing corrections to be
determined where necessary (shorter wavelengths), so that the
the on-source flux density can be corrected for pointing
error.
An example of flux measurements made with the 6 cm / 5 GHz and 3.5 cm
/ 8.5 GHz dual-beam receivers is shown below.
|
|---|
The radio quasar PKS 0405-385 was recently found
to show extreme variability on a timescale of less than an hour, which is
unprecedented among extragalactic radio sources. First detected in
observations with the Australia Telescope Compact Array, their monitoring
was supplemented by observations at Hartbeesthoek when the object was below
the horizon at the ATCA. In the image above, the dots represent ATCA data
and the triangles HartRAO data. From top to bottom, the observing
frequencies are 8.6, 4.8, 2.4 and 1.4 GHz. These data were taken on 1996
June 8 and 9. For more information see Kedziora-Chudczer et al. (1997)
Astrophysical Journal, 490, L9-L12.
Image by George Nicolson, HartRAO
Mapping extended radio sources
Starting in the 1980's the radio emission of almost the entire southern sky
was mapped using the 26m telescope in a collaboration between astronomers at
Rhodes University in Grahamstown and at HartRAO. The completed radio map
was published by Jonas, Baart and Nicolson (1998, MNRAS, 297, 977-989). The
map is shown below in galactic coordinates.
The control system for the 26m telescope has the ability to make scans for
creating maps using any installed receiver, under the queue scheduler.
|
|---|
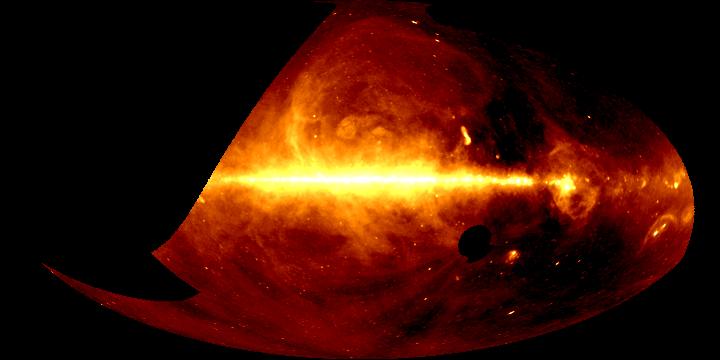
This map shows the radio emission along the plane of the Milky Way at a
frequency of 2326 MHz (13 cm wavelength). The map is in Galactic
coordinates so that the direction towards the centre of the Milky Way is in
the middle of the map. Radio emission from the inner spiral arms, seen edge
on, produces the white horizontal band across the centre. The radio galaxy
Centaurus A is the yellow "worm" above and to the right of the centre of the
picture. Its optical counterpart is called NGC5128. The Gum nebula is the big
bubble above and below the galactic plane to the right of centre, the Vela
supernova remnant being the yellow area within it. The nebulae in Orion,
surrounded by Barnard's Loop, are visible in the lower right corner. Bright
spots away from the galactic plane are not stars, but mainly radio-emitting
galaxies and quasars.
Image by Justin Jonas, Rhodes University / HartRAO